Bombs —

These three links caught my attention as a group and I thought I’d share them here.


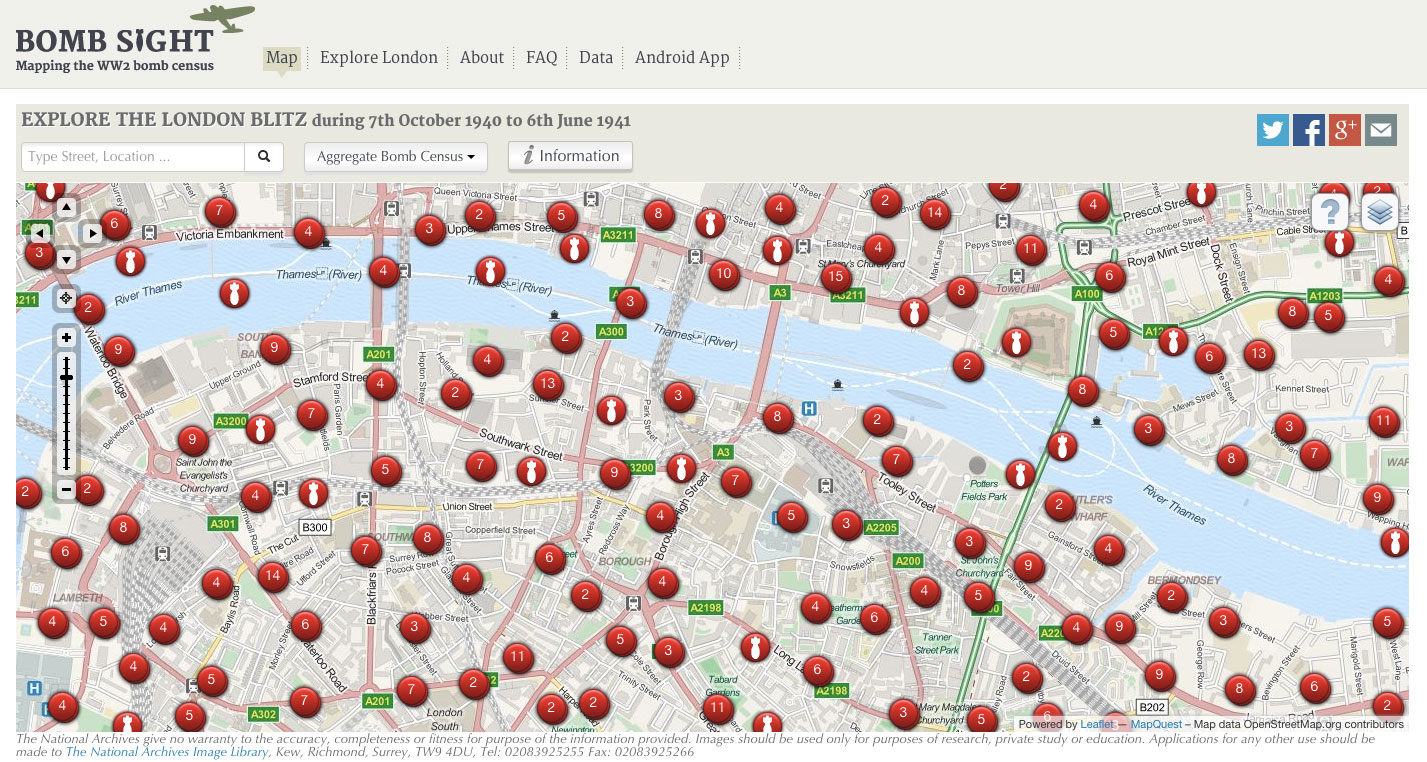
Bomb Sight uses archival data and modern mapping software to display where all the recorded bombs fell on London during WW2. The delivery mechanism means people immediately search for the places and areas that they live, work and inhabit everyday. Being able to relate archival data to your life now is such a powerful way to connect with history and to understand the blitz’s impact.


Starfish sites where created away real bombing targets in the UK to try and draw attention and bombs from German raids.


Wartime factories on the west coast of America created elaborate set designs on top of their factories to disguise them as fields and suburban streets. 


Data Granularity —

This went round the studio the other day: catswing.io


It brilliantly and simply shows how much space costs in London. It got me thinking about data granularity and how you could compare this map to Whereabouts London and also Rightmove


Each has more and more data and information about the various areas, and of course each has their place. But I wonder if there’s not enough clear information similar to Catswing for other issues or data heavy questions. What other problems could be better of more clearly explained? Sometimes all you need is the overview where someone’s done all the hard work for you.


Territories Map

This is the map i created for my map of my project so far. It is pretty much a glorieifed spider diagram- 25 words which can be linked most ways and any random 5 would create an interesting relationship and project. The map is firstly an illustration of my territory- this is the words. On the other side are various shapes of various sizes. The tool part of it starts when the viewer is asked to pick a set of 5 cards- do they pick all the cards of a certain shape, all the cards of a certain size ones, or the diagonals, the most aesthetic pattern or randomly. These choices then corespond to the words on the reverse creating new groupings. (The words on the reverse are also ordered (by shape) into 5 categories Curation:    labeling, criteria, rhyming objects, display.

Frames and Boundaries:    gaps, proximity, storage, horizontal space

Accumulation:        repetition, gathering, acquisition, copying

The Collector:        sequential, completion, validation, context abstraction

The Artifact:        taxidermy, scale and proportion, typologies, sets and groups, specimen

At the moment these are also functioning as chapter headings for my context report but im pretty sure ill  need to hack these down to a more managable size.